India’s agricultural production and statistics
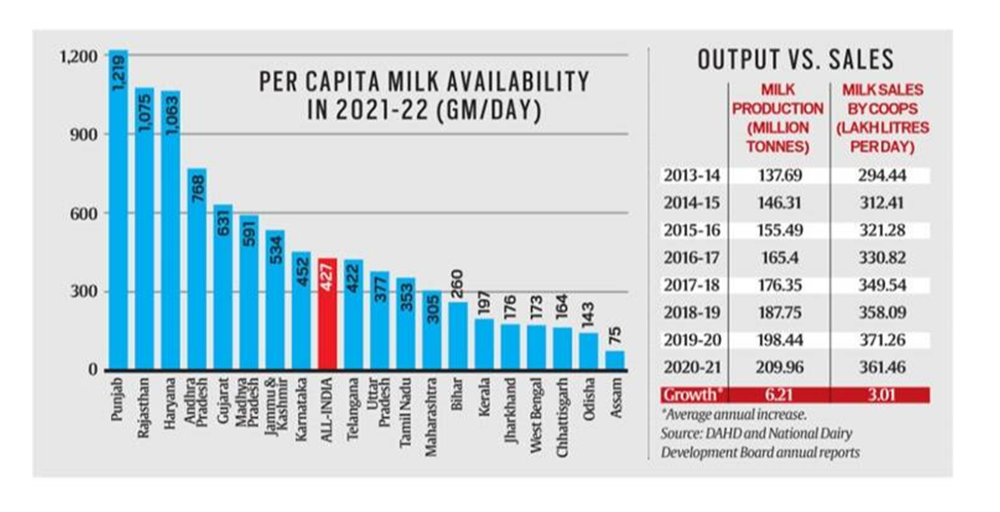
- Going by Department of Animal Husbandry & Dairying (DAHD) statistics, India’s milk production in 2011-12 was 127.9 mt with a daily per capita availability of 289 gm.
- These were 210 mt and 427 gm respectively in 2020-21.
Milk production statistics in India
- 2013-14 - 2020-21 → India’s milk production grew at an average 6.2% a year.
- Isn’t reflected in the marketing of liquid milk by dairy cooperatives, which grew by just over 3% annually in volume.
- Private sector growth of 12 major dairy companies averaged 4.93% in nominal terms between 2014-15 and 2020-21.

Discrepancies
- 6.2% growth in milk production does not seem to square up with the sales growth of organised dairies, averaging only 2-3% per year.
- Discrepancies in the per capita daily milk availability of 427 gm for 2020-21.
- Even after factoring in indirect/non-household consumption and population increase since 2011-12, the per capita average for these high milk-drinking states is unlikely to exceed 0.5-0.6 litres.
Demand is the key
- Knowing what and how much Indians are consuming is useful for analysis of demand and supply in other farm produce too.
- Helps in framing policies better, whether on fixation of minimum support prices and tariffs or on crop diversification.
- Also, cereal production from 2016-17 to 2020-21 has averaged 267 mt.
- If the Agriculture Ministry’s output estimates are accurate, the country is producing 30 mt-plus of surplus grain every year.
Need for Household Consumer Expenditure (HCE) Index
- The current consumer price index — used to calculate inflation and also for RBI’s interest rate actions — is based on the consumption basket from the 2011-12 HCE survey.
- That basket is perhaps outdated and not truly representative of the items, both food and non-food, being consumed by Indian households today.
Prelims Takeaway
- CPI
- Household Consumer Expenditure (HCE) Index
